Question 1 (b)
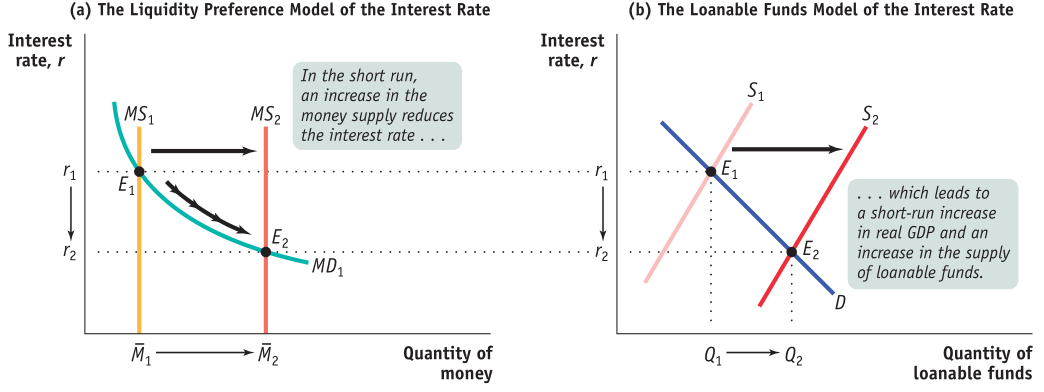
Graph of the money market vs Graph of the loanable funds market
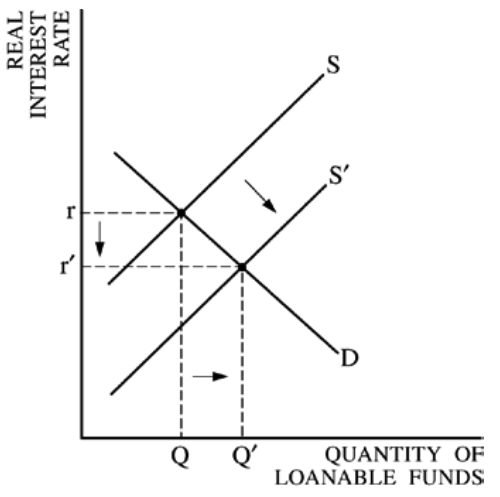
Graph of the loanable funds market
x-axis: Quantity of Loanable Funds
y-axis: Real Interest Rate
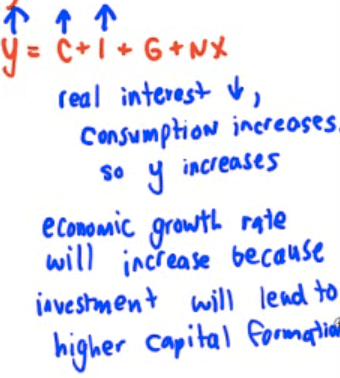
Question 1 (c)
More investment, higher GDP growth rate
Question 1 (d)
Foreign exchange market for the euro
x-axis: Quantity of Euro
y-axis: Dollar per Euro
Label e on the y-axis as exchange rate
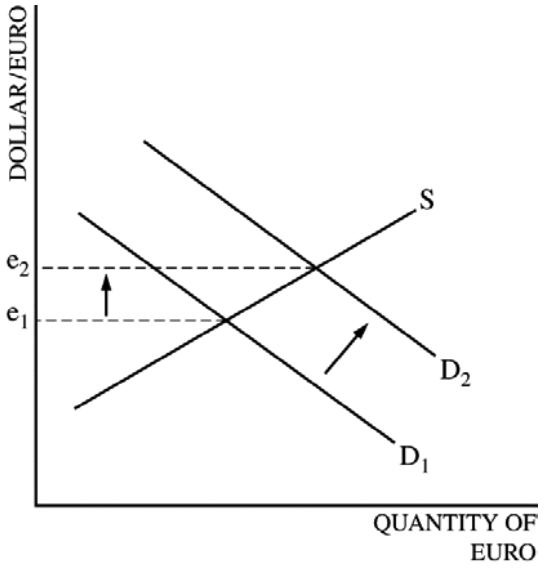
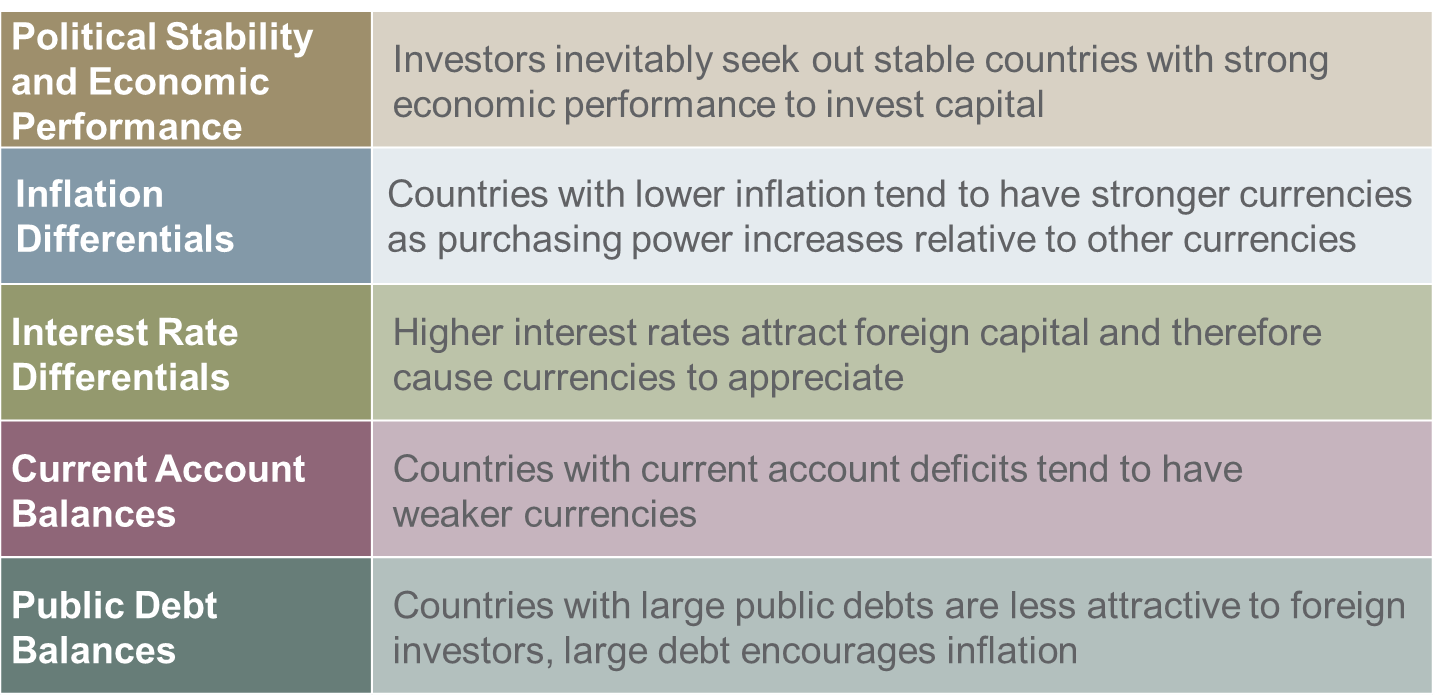
The demand for the euro increases because the higher real interest rate in the euro zone leads to higher returns for financial investments in the euro zone, attracting funds from the United States to the euro zone.
Question 1 (e)
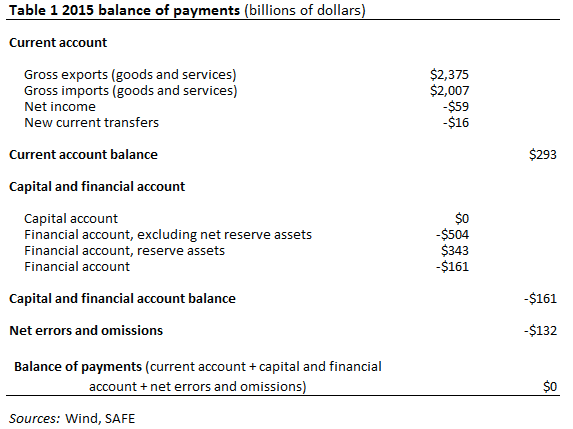
Current Account
Depreciate = Deficit
Appreciate = Surplus

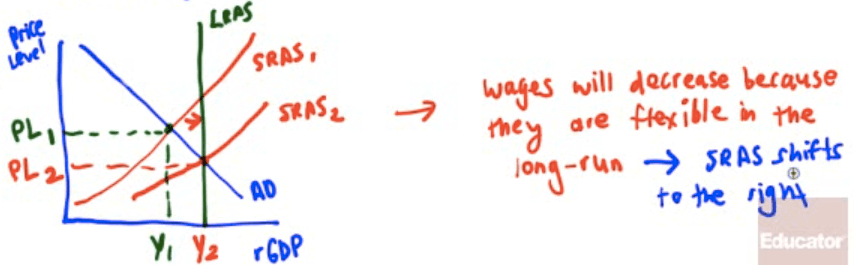
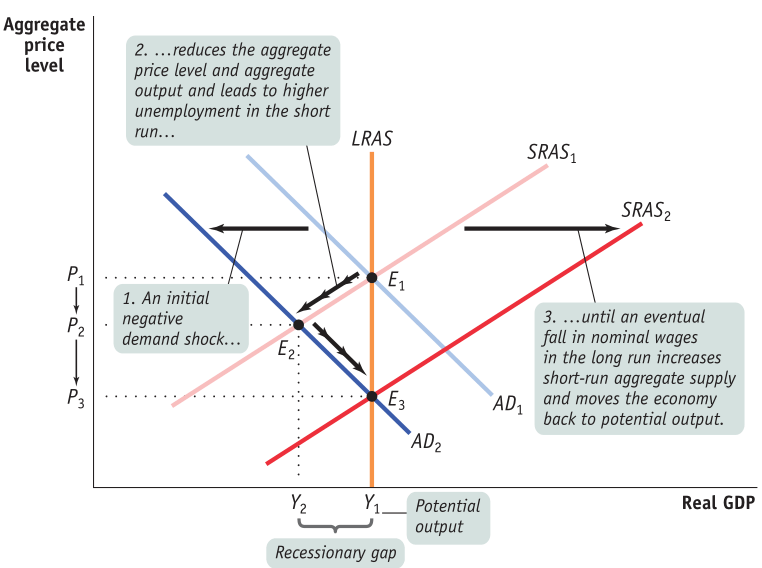
Question 2 (e)

SRAS will increase because wages and some other production costs decrease during a recession
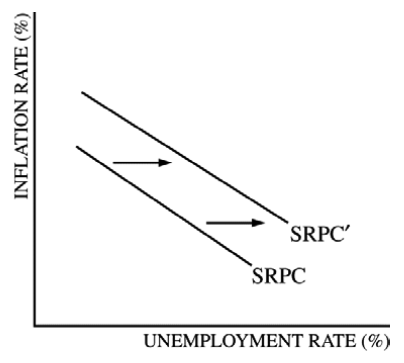
Question 3 (a)
x-axis: Unemployment rate
y-axis: Inflation rate
Question 3 (e)
- Real Interest Rate = Nominal Interest Rate - EXPECTED Inflation Rate